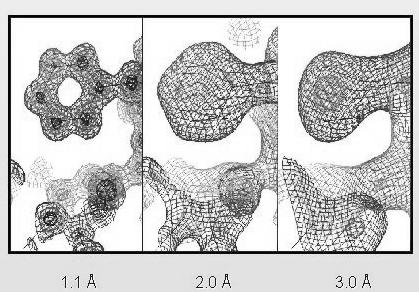
Experimental 3D structures of proteins, at atomic resolution, are obtained by X-ray crystallography and NMR. How the structures are obtained is beyond the scope of this lecture. Nevertheless, some important aspects of both techniques are highlighted in the following table:
| X-ray crystallography | NMR | |
|---|---|---|
| size limitations | none | 30 kD |
| material required | about 0.1 µmol | about 1 µmol |
| sample | monocrystalline | solution |
| sample concentration | about 15 mM | about 1 mM |
| principle | X-ray diffraction by electrons | nuclear magnetic resonance |
| observations | reflection intensities | NOE's, coupling constants |
| model fit versus | electron density map | local interatomic distances |
In both techniques an atomic model of the protein is constructed so
that it is consistent with the experimental data. Crystallographers fit
the model in the electron density map, while NMR spectroscopists try to
come up with a model that explains the observed distances as good as possible.
Crystallographic models consist for each atom of Cartesian x , y, z coordinates
and a so called B-factor that indicates the mobility of the atom. NMR models
have also Cartesian coordinates but describe mobility and lack of sufficient
data in terms of alternative models. Obviously, the larger the number of
observations the better the quality of the model is. This is illustrated
in a crystallographic example that shows the fit of a phenylalanine side
chain in electron density (a smaller resolution corresponds to a larger
number of observations):

It has to be stressed that the quality of a structure is a global property in crystallography, and a local one in NMR. Each crystallographic observation has contributions from all atoms, while NOE's only bear upon the local protein environment. Crystallographers always describe the global quality of the model by the R-factor or residual index. The lower the R-factor the better the model explains the observations. Typically the R-factor (%) is better than 10 times the resolution for a good model (e.g. R < 25% for a 2.5 Å structure).
At least the same number of experimental observations are required for the system to be mathematically determined, a condition often experimentally not met. Luckily, our knowledge about structural aspects that are invariant with respect to protein conformation can be added into the equation in terms of restraints, making the problem mathematically tractable. Such knowledge consists of bond lengths and angles, the shortest possible distance between to non-covalently bound atoms, etc. Nevertheless it is always wise to check the ratio of number of observations versus number of model parameters:
| Data | obs / parameters |
|---|---|
| Crystal at 4.0 Å | 0.25 |
| Crystal at 3.0 Å | 0.6 |
| Crystal at 2.5 Å | 1.0 |
| Crystal at 2.0 Å | 2.0 |
| Quality NMR study | 0.4 |
For more background: