# This example shows how a nonlinear axis definition can be used to
# set up log-scale axes. This meachanism is an alternative to the
# logscale implementation provided by previous versions of gnuplot.
# E.g.
# set nonlinear x via log10(x) inverse 10**x
# set xtics log
# rather than the original command "set logscale x"
#
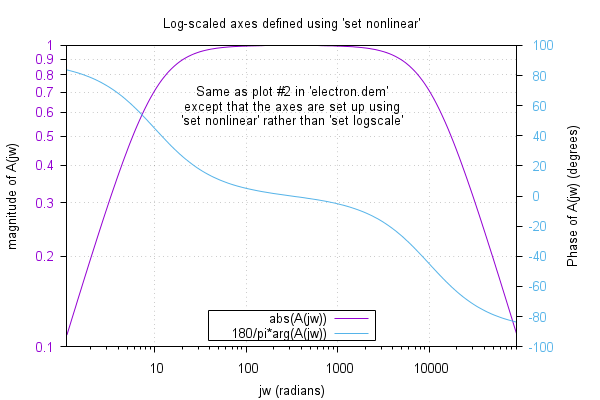
# This plot is the same as plot #2 in electrom.dem showing log-scaled axes.
#
set title "Log-scaled axes defined using 'set nonlinear'"
set label 1 "Same as plot #2 in 'electron.dem'\nexcept that the axes are set up using\n'set nonlinear' rather than 'set logscale'" at graph 0.5, 0.85, 0 center norotate back nopoint
set dummy jw, y
set grid xtics ytics
set key inside center bottom vertical Right noreverse enhanced autotitle box
set samples 160, 160
set style data lines
set xtics border out scale 1,0.5 nomirror
set mxtics 10.000000
set ytics border out scale 1,0.5 nomirror
set ytics norangelimit autofreq textcolor rgb "dark-violet"
set y2tics border out scale 1,0.5 nomirror
set y2tics norangelimit autofreq textcolor rgb "#56b4e9"
set xlabel "jw (radians)"
set ylabel "magnitude of A(jw)"
set y2label "Phase of A(jw) (degrees)"
#
set xrange [ 1.1 : 90000.0 ] noextend
set yrange [ 0.1 : 1.0 ]
#
set nonlinear x via log10(x) inverse 10**x
set nonlinear y via log10(y) inverse 10**y
set xtics log
#
A(jw) = ({0,1}*jw/({0,1}*jw+p1)) * (1/(1+{0,1}*jw/p2))
p1 = 10
p2 = 10000
#
plot abs(A(jw)) lt 1, 180/pi*arg(A(jw)) axes x1y2 lt 3
Click here for minimal script to generate this plot
