ASN G 44
ILE H 74
ILE D 74
GLU D 83
GLU F 29
ARG D 73
GLU D 29
ASP E 70
ARG E 94
LYS G 43
GLU G 79
| PARVATI analysis of 3chb | Wed Sep 16 13:52:35 2009 |
|---|
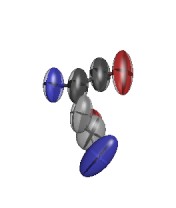
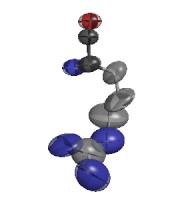
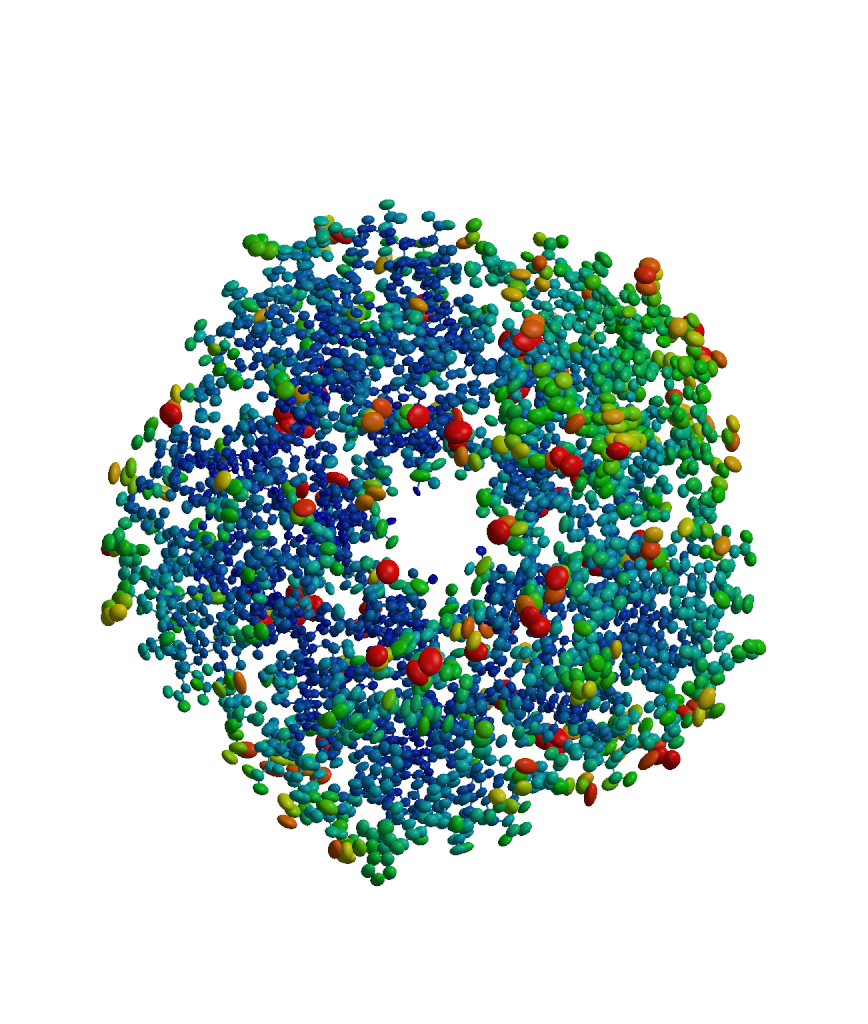
 Anisotropy is defined as the ratio of the minimum and maximum
Eigenvalues of the 3x3 matrix of anisotropic displacement parameters (ADPs).
This is the square of the axial ratio of an ellipsoid representing the atom.
The ratio is 1.0 for a perfectly isotropic (spherical) atom.
As the ratio decreases from 1.0 to 0.0, it describes an increasingly
non-spherical atom, either a 'pancake' or a 'cigar'.
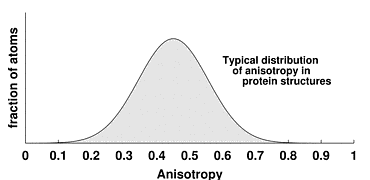
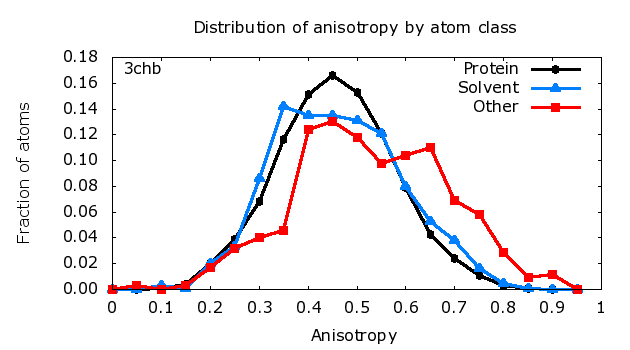
The figure to the right shows a typical distribution of anisotropy,
with mean 0.45 and standard deviation 0.15, based on analysis of
structures in the Protein Data Bank
[Merritt (1999) Acta Cryst. D55, 1109-1117].
When analyzing a newly-refined protein model for which the distribution of
anisotropy is substantially different from the plot shown, you should
investigate whether the restraints applied to ADPs during refinement were
appropriately weighted.
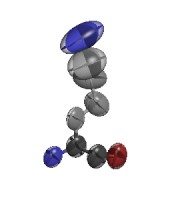
Anisotropy is defined as the ratio of the minimum and maximum
Eigenvalues of the 3x3 matrix of anisotropic displacement parameters (ADPs).
This is the square of the axial ratio of an ellipsoid representing the atom.
The ratio is 1.0 for a perfectly isotropic (spherical) atom.
As the ratio decreases from 1.0 to 0.0, it describes an increasingly
non-spherical atom, either a 'pancake' or a 'cigar'.
The figure to the right shows a typical distribution of anisotropy,
with mean 0.45 and standard deviation 0.15, based on analysis of
structures in the Protein Data Bank
[Merritt (1999) Acta Cryst. D55, 1109-1117].
When analyzing a newly-refined protein model for which the distribution of
anisotropy is substantially different from the plot shown, you should
investigate whether the restraints applied to ADPs during refinement were
appropriately weighted.
Since the purpose of the Parvati script is to analyze anisotropy, atoms which are perfectly isotropic are not included in the statistical summaries. Atoms with no ANISOU record and atoms whose ADPs describe a perfect sphere are ignored.
A breakdown by atom type is given only if the input PDB file contains the atom type in columns 77:78. This is standard as of 1997, but not all PDB files conform to the standard. Oxygen atoms in residue types HOH, H2O, or WAT are listed as "solvent", and are not included in the breakdown by atom type.
HEADER    TOXIN                                   24-MAR-98   3CHB
TITLE     CHOLERA TOXIN B-PENTAMER COMPLEXED WITH GM1 PENTASACCHARIDE
AUTHOR    E.A.MERRITT,W.G.J.HOL
REVDAT   3   28-JUL-09 3CHB    1       HET    HETATM
REVDAT   2   24-FEB-09 3CHB    1       VERSN
REVDAT   1   12-AUG-98 3CHB    0
REMARK   2 RESOLUTION.    1.25 ANGSTROMS.
************************************************
 Raster3D Thermal Ellipsoid Program V2.7EAM
 E A Merritt -  03 Sep 2009
************************************************
... no errors found in input file
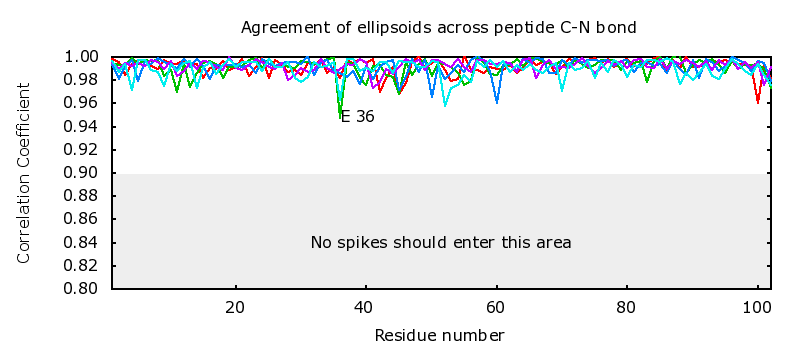
 GLU E  36         MET E  37     CCuij =   0.9478
  CG1A ILE E__74          CD1B ILE E__74     Suv =   0.9737
  CG   ASP H__59          OD2  ASP H__59     Suv =   0.9714
 Atom    Residue     Principle axes       Anisotropy    Uiso
_____ __________  ____________________    __________  ______

   C3 GAL D__104  0.2137 0.1244 0.0167        0.0783  0.1183
Atom Residue Principle axes Anisotropy Uiso
_____ __________ ____________________ __________ ______
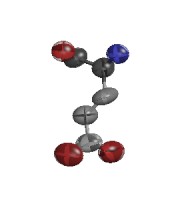
O ASN G___44 0.6556 0.1607 0.0798 0.1218 0.2988
O HOH H_9468 0.9092 0.2470 0.1179 0.1296 0.4247
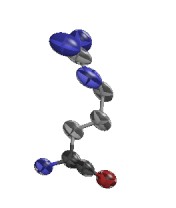
CD1B ILE H___74 0.1393 0.1182 0.0188 0.1353 0.0921
CD1B ILE D___74 0.1641 0.1087 0.0235 0.1432 0.0987
O HOH D_9322 0.8159 0.3222 0.1199 0.1469 0.4193
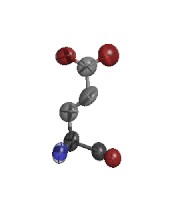
OE2 GLU D___83 0.5824 0.2142 0.0894 0.1535 0.2954
O2 GAL F__104 0.4531 0.1656 0.0732 0.1614 0.2306
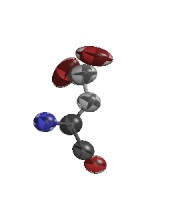
CB GLU F___29 0.4399 0.2023 0.0729 0.1657 0.2384
CD ARG D___73 0.2206 0.1443 0.0370 0.1678 0.1340
CG GLU D___29 0.3377 0.1530 0.0571 0.1691 0.1826
OD2 ASP E___70 0.5663 0.2901 0.0971 0.1716 0.3178
NH1 ARG E___94 0.7557 0.3862 0.1303 0.1724 0.4240
CB LYS G___43 0.3965 0.1819 0.0724 0.1825 0.2170
OE2 GLU G___79 0.7280 0.4444 0.1375 0.1888 0.4366
O ASN E___44 0.6961 0.2590 0.1323 0.1901 0.3625
OG1 THR F___15 0.6179 0.2133 0.1182 0.1913 0.3164
NZ LYS G___62 0.7371 0.5941 0.1426 0.1935 0.4913
ND2 ASN F____4 0.5351 0.2127 0.1042 0.1947 0.2840
ND2 ASN G___14 0.2733 0.2453 0.0534 0.1956 0.1907
NH2 ARG H___67 0.3797 0.1833 0.0746 0.1965 0.2125
NZ LYS G___84 0.7581 0.2377 0.1499 0.1977 0.3819
O HOH H_9366 0.6464 0.2217 0.1280 0.1980 0.3321
NH1 ARG E___73 0.5249 0.1799 0.1049 0.1998 0.2699
| ASN G 44 |
ILE H 74 |
ILE D 74 |
GLU D 83 |
GLU F 29 |
ARG D 73 |
| GLU D 29 |
ASP E 70 |
ARG E 94 |
LYS G 43 |
GLU G 79 |
Distribution of anisotropy by atom class |
|||||
protein atoms# Anisotropy Fraction Number # range of atoms of atoms 0.00 0.05 0.000 0 0.05 0.10 0.000 0 0.10 0.15 0.001 3 0.15 0.20 0.004 16 0.20 0.25 0.020 80 0.25 0.30 0.039 160 0.30 0.35 0.068 278 0.35 0.40 0.116 474 0.40 0.45 0.151 620 0.45 0.50 0.166 682 0.50 0.55 0.153 629 0.55 0.60 0.121 496 0.60 0.65 0.079 323 0.65 0.70 0.043 175 0.70 0.75 0.024 97 0.75 0.80 0.011 46 0.80 0.85 0.003 14 0.85 0.90 0.001 5 0.90 0.95 0.000 0 0.95 1.00 0.000 0 # # number of ANISOU records: 4098 # non-isotropic atoms: 4098 # isotropic atoms: 0 # # correlation of anisotropy with B_iso: -0.354 # # Anisotropy B_iso # AtomType mean sigma mean number # --------- ----------- ------ ------ #| Total 0.483 0.119 14.21 4098 |
solvent atoms# Anisotropy Fraction Number # range of atoms of atoms 0.00 0.05 0.000 0 0.05 0.10 0.000 0 0.10 0.15 0.003 2 0.15 0.20 0.001 1 0.20 0.25 0.020 15 0.25 0.30 0.033 25 0.30 0.35 0.086 65 0.35 0.40 0.142 108 0.40 0.45 0.135 102 0.45 0.50 0.135 102 0.50 0.55 0.131 99 0.55 0.60 0.121 92 0.60 0.65 0.080 61 0.65 0.70 0.053 40 0.70 0.75 0.038 29 0.75 0.80 0.016 12 0.80 0.85 0.005 4 0.85 0.90 0.001 1 0.90 0.95 0.000 0 0.95 1.00 0.000 0 # # number of ANISOU records: 758 # non-isotropic atoms: 758 # isotropic atoms: 0 # # correlation of anisotropy with B_iso: 0.111 # # Anisotropy B_iso # AtomType mean sigma mean number # --------- ----------- ------ ------ #| Total 0.486 0.128 26.61 758 |
non-solvent HETATMs# Anisotropy Fraction Number # range of atoms of atoms 0.00 0.05 0.000 0 0.05 0.10 0.003 1 0.10 0.15 0.000 0 0.15 0.20 0.003 1 0.20 0.25 0.017 6 0.25 0.30 0.032 11 0.30 0.35 0.040 14 0.35 0.40 0.046 16 0.40 0.45 0.124 43 0.45 0.50 0.130 45 0.50 0.55 0.118 41 0.55 0.60 0.098 34 0.60 0.65 0.104 36 0.65 0.70 0.110 38 0.70 0.75 0.069 24 0.75 0.80 0.058 20 0.80 0.85 0.029 10 0.85 0.90 0.009 3 0.90 0.95 0.012 4 0.95 1.00 0.000 0 # # number of ANISOU records: 347 # non-isotropic atoms: 347 # isotropic atoms: 0 # # correlation of anisotropy with B_iso: 0.252 # # Anisotropy B_iso # AtomType mean sigma mean number # --------- ----------- ------ ------ #| Total 0.552 0.152 22.62 347 | |||
Agreement of ellipsoids across peptide C-N bond | |
|---|---|
|
|
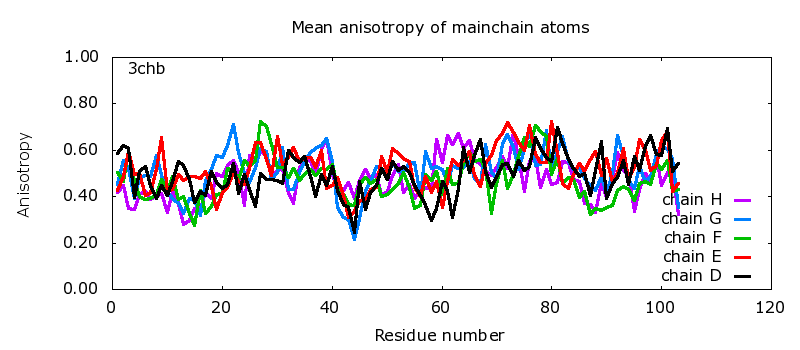
Mean anisotropy of mainchain atoms | |
|---|---|
|
|
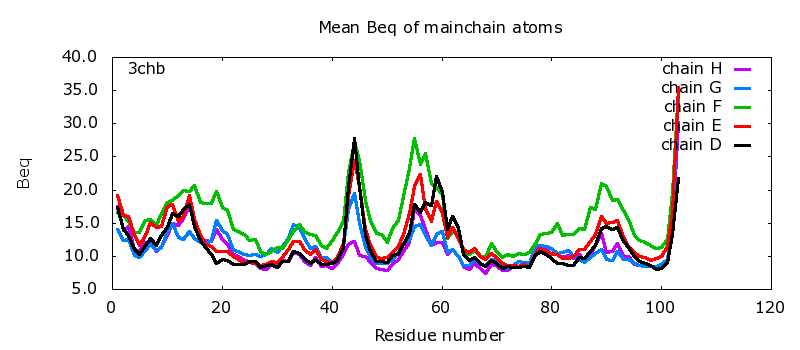
Mean Beq of mainchain atoms | |
|---|---|
|
|
Distribution of anisotropy by atom class | |
|---|---|
|
|
3chb Summary | ||||||||||||||||||||||||||||||||||||||||||||
|---|---|---|---|---|---|---|---|---|---|---|---|---|---|---|---|---|---|---|---|---|---|---|---|---|---|---|---|---|---|---|---|---|---|---|---|---|---|---|---|---|---|---|---|---|
|
Click for larger image |
|||||||||||||||||||||||||||||||||||||||||||
0 atoms ( 0.0%) with non-positive definite ADPs 1 atoms ( 0.0%) with anisotropy < 0.10 24 atoms ( 0.5%) with anisotropy < 0.20 0 atoms in the protein are perfectly isotropic 2 pairs of neighboring atoms have S(u,v) < 0.975 1 C-N linkages had correlation < 0.950 |
||||||||||||||||||||||||||||||||||||||||||||